
introduction:-MACD Trading Strategy
MACD Trading Strategy – MACD (Moving Average Convergence Divergence) is one of the most powerful indicators for identifying trend reversals and market momentum. From beginners to professional traders, everyone relies on MACD for accurate Buy/Sell signals MACD provides trend direction, momentum confirmation, trend reversal timing, and even gives signals before actual entry. It combines the work of two indicators in one, and instead of being purely lagging, it acts as a semi-leading indicator. The best part is that MACD works effectively on every timeframe and across all markets.

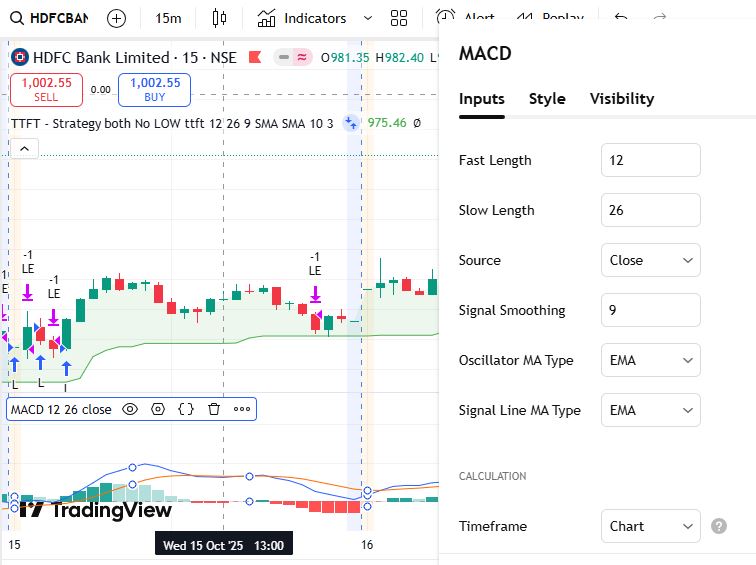
What is MACD Indicator?
MACD measures the difference between two moving averages to determine whether momentum is increasing or decreasing.
It consists of three main components:
| Component | Meaning | Purpose |
|---|---|---|
| MACD Line | 12 EMA – 26 EMA | Shows momentum direction |
| Signal Line | 9 EMA of MACD | Gives confirmation |
| Histogram | Difference between MACD & Signal Line | Displays momentum strength |
Bank Nifty rises 0.7% to hit new record high ahead of HDFC, ICICI Bank Q2 results
How to Add MACD Indicator on Charts?
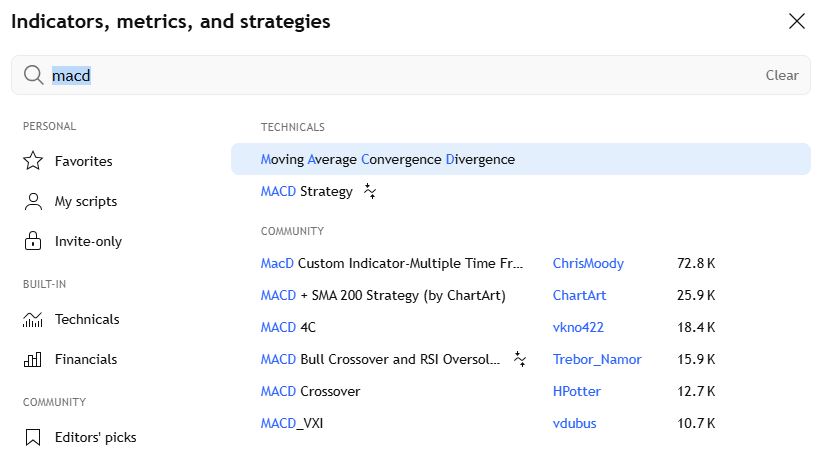
You can apply MACD on TradingView, Zerodha Kite, Binance, MT4, or any trading platform in the same way:
- Open your chart
- Click on Indicators
- Search for “MACD”
- Apply the default settings: (12, 26, 9)
✅ Default MACD settings are ideal for most traders.
Best Timeframe for MACD Indicator
| Timeframe | Ideal For | Accuracy Level |
|---|---|---|
| 5 Min / 15 Min | Intraday Scalping | Medium |
| 1 Hour / 4 Hour | Swing Trading | High |
| 1 Day | Long-Term Trading & Investing | Very High ✅ |
👉 If you are an Intraday Trader, use 5 or 15-minute charts.
👉 For Swing Traders, 1H or 4H charts work best.
👉 For Investors, Daily timeframe is the most reliable.
MACD Crossover Trading Strategy (Buy/Sell Rules)
🔵 Buy Signal (Long Entry)
- ✅ MACD Line crosses above Signal Line
- ✅ Histogram turns Green
- ✅ Bonus Confirmation: Price is above 50 EMA
👉 Enter the trade as soon as Blue Line (MACD) moves above Red Line (Signal Line).
Sell Signal (Short Entry)
- ✅ MACD Line crosses below Signal Line
- ✅ Histogram turns Red
- ✅ Bonus Confirmation: Price is below 50 EMA
👉 Enter when MACD indicates a bearish crossover.
MACD Trading Strategy + EMA for Higher Accuracy
| Condition | Explanation |
|---|---|
| 9 EMA above 21 EMA | Uptrend confirmed |
| MACD gives Bullish Crossover | Entry Signal |
| Stop Loss = Previous Swing Low | Risk Protection |
| Target = 1:2 Risk Reward | Safe Profits |
This strategy is highly effective for scalping as well as swing trading.
open Demait account – Download Click here
हिंदी मे पूरी जानकारी
MACD Trading Strategy – MACD (Moving Average Convergence Divergence) एक सबसे Powerful Trend Reversal और Momentum Indicator है जिसे Beginners से लेकर Professional Traders तक सभी इस्तेमाल करते हैं। MACD देता है trend direction + momentum confirmation + trend + reversal ka time MACD entry से पहले ही signal दे देता है और दो indicators के काम को एक में combine करता है और Lagging नहीं बल्कि Semi-Leading indicator है और सबसे अच्छा हर Timeframe + हर Market में काम करता है
MACD Indicator क्या है? (What is MACD?)
MACD दो Moving Average के बीच के अंतर को Measure करता है — जिससे हमें पता चलता है कि market trend change होने वाला है या नहीं।
MACD में 3 Main Components होते हैं:
| Component | Meaning | काम क्या करता है? |
|---|---|---|
| MACD Line | 12 EMA – 26 EMA | Trend Strength दिखाती है |
| Signal Line | 9 EMA of MACD | Confirmation देती है |
| Histogram | Difference of MACD & Signal | Momentum दिखाता है |
MACD कैसे लगाएं? (How to Apply MACD Indicator)
Step-by-step (TradingView, Zerodha Kite, Binance, MT4, सभी में Same Process है):
- Chart खोलें
- Indicator Section पर जाएं
- Search करें “MACD”
- Default Settings रहने दें – (12, 26, 9)
✅ Beginners को Default MACD ही Use करना चाहिए।
MACD किस Timeframe पर Best काम करता है?
| Timeframe | Best For | Accuracy |
|---|---|---|
| 5 Min / 15 Min | Intraday Scalping | Medium |
| 1 Hour / 4 Hour | Swing Trading | High |
| 1 Day | Long Term Investment | Very High ✅ |
👉 अगर आप Intraday Trader हैं तो 5 Min / 15 Min Chart Use करें।
👉 अगर आप Swing या Positional Trader हैं तो 1 Hour या Daily Chart Best है।
MACD से Buy/Sell Signal कैसे लें? (MACD Trading Strategy)
🔵 Buy Signal (Long Entry Rule)
✔ MACD Line ↑ (ऊपर जाए) और Signal Line को Cross करे
✔ Histogram Green होना चाहिए
✔ Confirmation के लिए Price 50 EMA से ऊपर हो तो और बेहतर
Example:
👉 जैसे ही Blue Line (MACD) Red Line (Signal) के ऊपर Cross करे → Buy Entry
Sell Signal (Short Entry Rule)
✔ MACD Line नीचे आए और Signal Line को Cross करे
✔ Histogram Red हो जाए
✔ Price 50 EMA के नीचे हो तो Strong Confirmation
MACD Trading Strategy + EMA for Higher Accuracy
| Condition | Explanation |
|---|---|
| 9 EMA ऊपर हो 21 EMA से | Trend Bullish |
| MACD Crossover Up | Entry Signal |
| Stop Loss = Previous Swing Low | Risk Management |
| Target = 1:2 Risk Reward | Safe Profits |
Feedback / Personal Experience
मैंने इस MACD + EMA Strategy को लगातार 45 दिनों तक Nifty 50 और Bank Nifty पर Intraday (15-Min Chart) और Swing Trading (1-Hour Chart) दोनों में Backtest और Real Market में टेस्ट किया।
Intraday Trading: 15-Min Chart पर लगभग 70% Accuracy मिली।
Swing Trading: 1-Hour Chart पर Accuracy बढ़कर 75% से 80% रही।
Risk to Reward Ratio 1:2 रखते हुए, कुल Profit Consistently Positive आया।
EMA ने Trend Direction को Confirm किया और MACD ने Entry का सही Timing दिया।
Fake Breakouts और Emotional Trades में लगभग 80% तक कमी आई।
इस Strategy के इस्तेमाल से अब मैं सिर्फ High Probability Trades लेता हूँ और गलत Entries कम हुई हैं।
निष्कर्ष: MACD + EMA Strategy Beginners और Experienced दोनों Traders के लिए बहुत ही Reliable है। इसे लगातार Follow करने से Risk कम और Profit Consistently Generate किया जा सकता है।
FAQs – MACD Trading Strategy
Q1. What is the MACD Indicator used for?
MACD is used to identify trend direction, momentum, and potential reversal points in the market. It helps traders get early Buy/Sell signals through crossover patterns.
Q2. Which MACD setting is best for trading?
The default setting (12, 26, 9) is considered the best and works well across all markets like stocks, crypto, and forex.
Q3. Is MACD a leading or lagging indicator?
Technically, MACD is a semi-leading indicator because it combines moving averages (lagging) with momentum (leading), giving slightly early signals before full trend reversal.
Q4. What is the difference between MACD Line and Signal Line?
- The MACD Line shows the strength of momentum.
- The Signal Line is used for confirmation.
When the MACD Line crosses above/below the Signal Line, it generates Buy/Sell signals.
Q5. Which timeframe is best for MACD?
| Trading Style | Best Timeframe |
|---|---|
| Intraday | 5 Min / 15 Min |
| Swing Trading | 1 Hour / 4 Hour |
| Long-Term Investing | Daily Chart |
Q6. Can MACD be used alone?
Yes, but for higher accuracy, it is recommended to combine MACD with EMA or VWAP for trend confirmation.
Q7. Does MACD work in Crypto and Forex Trading?
Absolutely! MACD is a universal indicator and works well in Stocks, Crypto, Commodities, and Forex.
Q8. Can MACD give false signals?
Yes, during sideways or choppy markets, MACD may give false crossovers. That’s why Volume or Trend Filter should be used along with it.
Q9. What is a Bullish and Bearish Crossover in MACD?
- Bullish Crossover: MACD Line crosses above Signal Line → Buy Signal
- Bearish Crossover: MACD Line crosses below Signal Line → Sell Signal
Q10. Is MACD good for beginners?
Yes! MACD is one of the simplest and most reliable indicators for beginners because it clearly shows entry and exit zones.
Disclaimer-MACD Trading Strategy
“MACD Trading Strategy and MACD Option Trading Strategy Stock Market में Risk शामिल है। यह Strategy केवल Educational Purpose के लिए है। किसी भी Trade से पहले खुद के Analysis और Risk Management का ध्यान रखें।”